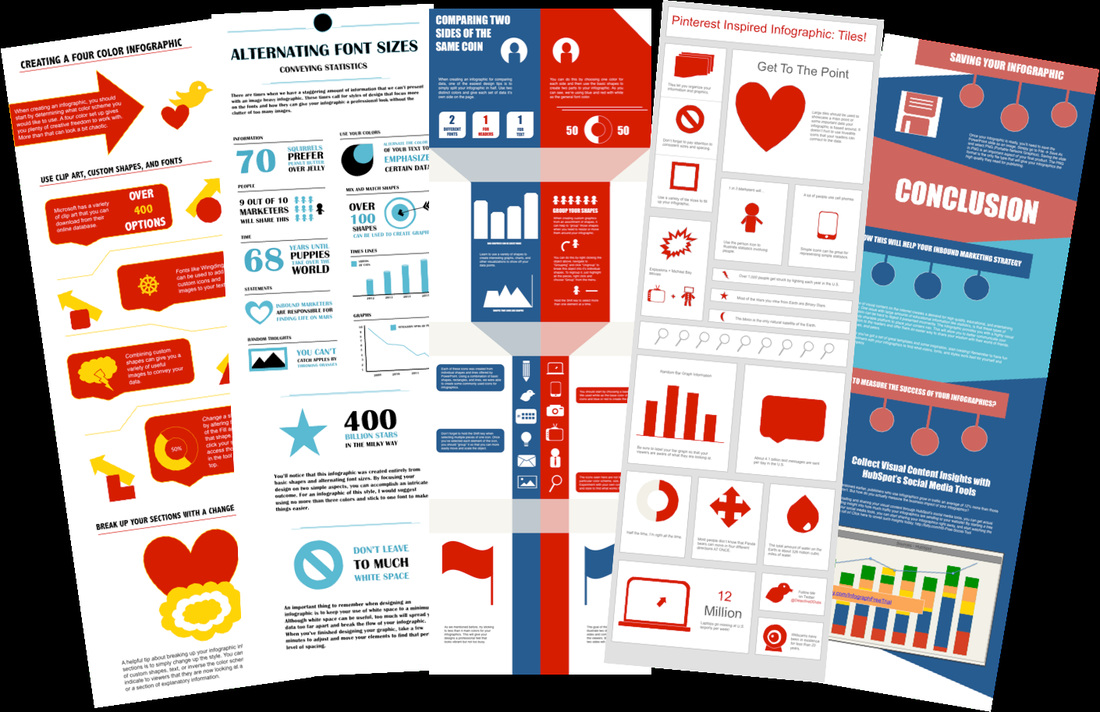
Infographics
Information graphics or infographics are graphic visual representations of information, data or knowledge intended to present complex information
quickly and clearly.They can improve understanding by utilizing graphics to enhance the human visual system’s
ability to see patterns and trends.The process of creating infographics can be referred to as data visualization, information design, or information
architecture. (Wikipedia)
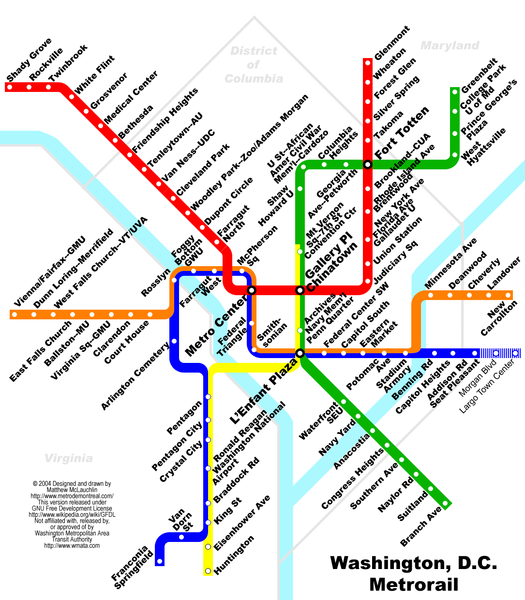
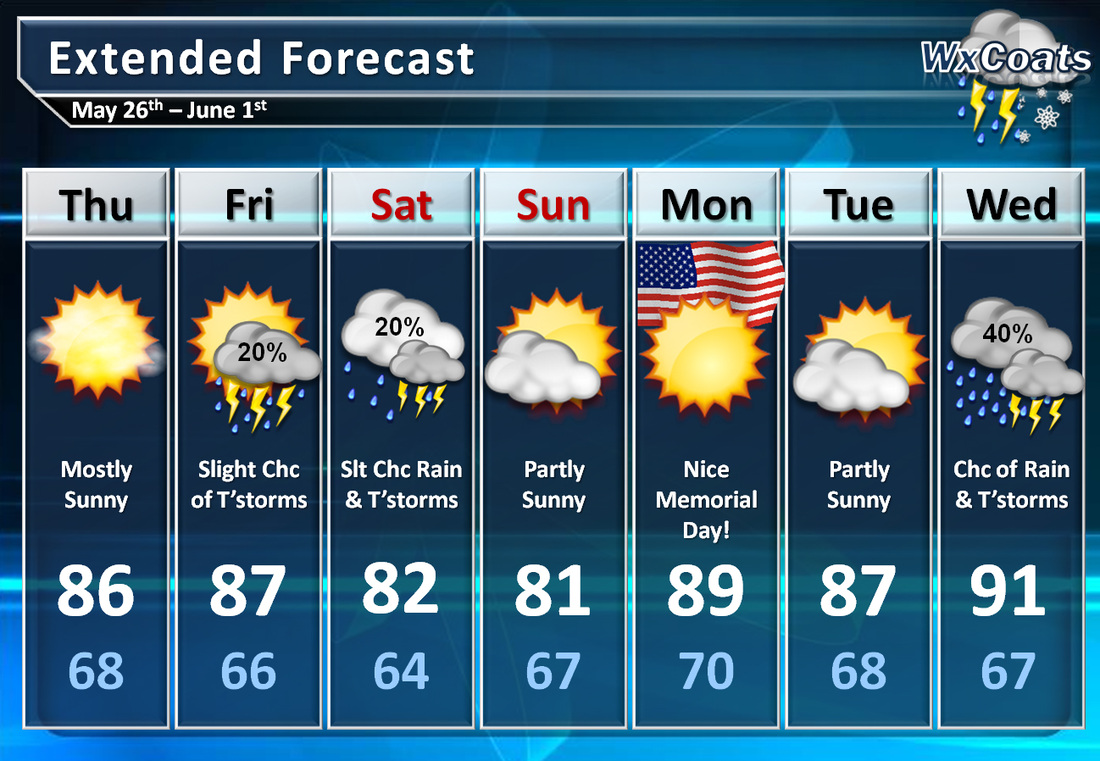
Examples of simple infographics are weather charts, metro maps. Books like David McCauley's The way things work are made entirely of infographics.
quickly and clearly.They can improve understanding by utilizing graphics to enhance the human visual system’s
ability to see patterns and trends.The process of creating infographics can be referred to as data visualization, information design, or information
architecture. (Wikipedia)
Examples of simple infographics are weather charts, metro maps. Books like David McCauley's The way things work are made entirely of infographics.
Online infographic makers
Infogr.am is an online tool for creating interactive charts, graphs, and interactive infographic posters. There are four basic chart types that yocan create on Infogr.am; bar, pie, line, and matrix. Each chart type can be edited to use any spreadsheet information that you want to upload to your Infogr.am account. The information in that spreadsheet will be displayed in your customized chart. When you place your cursor over your completed chart the spreadsheet information will appear in small pop-up window. Infogr.am infographics can include videos and maps along with pictures and text. Your Infogr.am projects can be embedded into your blog, website, or wiki.
Easel.ly provides a canvas on which you can build your own infographic by dragging and dropping pre-made design elements. You can use a blank canvas or build upon one of Easel.ly's themes. If Easel.ly doesn't have enough pre-made elements for you, you can upload your own graphics to
include in your infographic. Your completed infographic can be exported andsaved as PNG, JPG, PDG, and SVG files.
Piktochart provides seven free infographic templates. Each template can be customized by changing the colors, fonts, icons, and charts on each template. If you need more space on the template, you can add more fields at the bottom of the templates. If you need less space, you can remove fields from the templates.
Many Eyes is a visualisation tool created by IBM. Insert your data, decide on the visualisation type and create your graphic. There is some custom data to play around with.
Wordle. Create visualiations of important words, keywords and concepts. An easy to use interface with some ability to customise. Worldes can be printed or take a print screen of your word cloud, crop it and save into an image.
EWC Presenter is a new tool from Easy Web Content (a website creation and hosting service). The EWC Presenter's infographic animation option is worth noting. EWC Presenter's infographic tool allows you to animate elements within your infographic. EWC Presenter infographics support audio
files.
You can also use the graphic features of PowerPoint including graphs, tables, and autoshapes.
Animated Infographics
Animated infographics can also be created as short videos. Add interest is given to text and graphics when they are combined with movement. Animation tools such as Adobe After Effects, Prezi and the animation features of PowerPoint can be employed to create powerful visualisations. The examples below show some of the techniques you can use.
|
|
|